Essential Supply Chain KPIs Every Manager Should Track
Are you looking for the exact metrics that move the needle in your operation? You need more than just a list of supply chain KPIs. You need to know which ones reveal the truth about your efficiency and which ones are just noise. We have gathered the specific data points that top-tier managers use to identify bottlenecks before they become crises. This is the detailed breakdown you have been searching for to turn your raw data into a competitive advantage.
You likely already know that tracking performance is necessary. However, general overviews often fail to explain how these metrics interact or what a “good” number actually looks like for your specific industry. We are going to get straight into the details of the most critical supply chain metrics, focusing on actionable formulas and industry benchmarks. For a complete overview of how these metrics fit into your broader organizational goals, check out our main guide on supply chain strategy framework. Let us get specific about what you should be measuring right now.

The Gold Standard: Perfect Order Rate (POR)
When it comes to supply chain KPIs, the Perfect Order Rate is the most telling metric you can track. It is a composite indicator that measures how well your entire system works together. A “perfect” order is one that meets every single customer requirement without a single hitch. If you want a clear picture of your operational health, this is where you start. Here is the specific answer to what makes an order perfect.
The POR is calculated by looking at several sub-metrics. We look at orders delivered on time, shipped in full, received damage-free, and processed with accurate documentation. To find your percentage, you multiply the success rates of these four components. For example, if your on-time rate is 95 percent and your accuracy rate is 95 percent, your POR is already dropping. This is the detail that changes everything because it exposes hidden failures in your process.
What should you aim for? Industry leaders generally target a 95 percent or higher Perfect Order Rate. If your rate is lower, your first move is to identify which of the four components is dragging the average down. Are you shipping on time but with incorrect paperwork? Or is the documentation perfect but the goods are arriving damaged? The practical takeaway is that POR forces you to fix the weakest link in your chain rather than celebrating partial successes.

On-Time Delivery and the Cost of Delays
On-Time Delivery (OTD) is often the metric that keeps managers up at night. This is one of those areas where getting it right makes a real difference in customer retention. Research from industry authorities suggests that 69 percent of consumers are less likely to shop with a brand again if an order is delayed by just two days. We have seen this happen constantly. A single late shipment can undo months of relationship building.
To calculate OTD, you take the number of orders delivered by the promised date and divide it by the total number of orders shipped. Your best move here is to aim for a benchmark of 95 percent or higher. If you are consistently hitting below this mark, you likely have a visibility problem. Enhancing your tracking capabilities is essential here. You can learn more about solving this in our guide on supply chain visibility strategies. Better visibility leads to better OTD scores.
Here is what that actually looks like in practice. You should not just track when the package leaves your warehouse. You must track when it hits the customer’s door. Advanced systems like modern ERPs or AI-driven logistics platforms have been shown to improve OTD by as much as 39 percent. If your current manual tracking is failing you, the action item here is simple. It is time to automate your delivery confirmation data to get a true OTD reading.
Inventory Turnover: Measuring Capital Efficiency
Inventory is often the largest asset on a balance sheet, but it is also the most dangerous if it sits still for too long. The Inventory Turnover Ratio tells you how many times your company has sold and replaced its inventory during a specific period. This is the specific situation where efficiency translates directly into cash flow. A high turnover indicates that you are moving products quickly, while a low ratio suggests overstocking or weak sales.
The formula is straightforward. You take the Cost of Goods Sold (COGS) and divide it by your Average Inventory. A healthy range for most manufacturing and retail sectors is between 5 and 10. If your number is 2, you are carrying far too much dead stock. If your number is 15, you might be at risk of frequent stockouts. You want to find the “Goldilocks” zone where you are lean but not fragile.
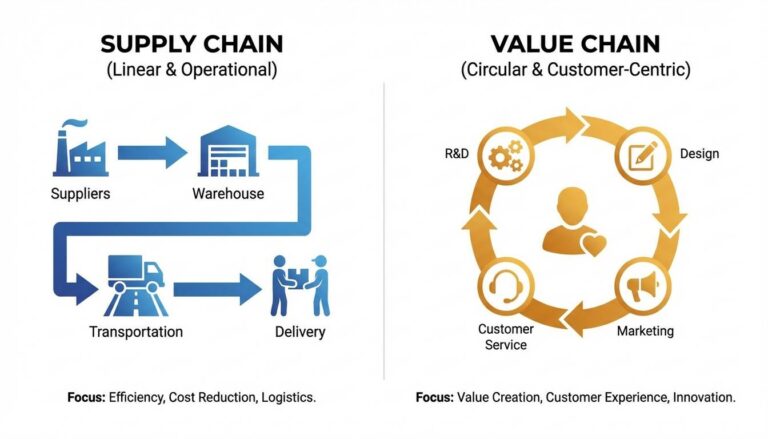
So what does this mean for you? If your turnover is low, you need to look at your procurement strategy. Are you buying in bulk just to get a discount that is eventually eaten by storage costs? Your next step is to audit your slowest-moving SKUs. This allows you to free up capital for items that actually generate revenue. Managing this balance is a core part of understanding the supply chain vs value chain dynamic, where every inventory decision adds or subtracts value.

Cash-to-Cash Cycle Time
This is the metric that your CFO cares about most. The Cash-to-Cash (C2C) cycle time measures how long it takes for a dollar spent on raw materials to come back into your pocket as revenue. The shorter the cycle, the more liquid your business remains. Here is the step-by-step breakdown of how to calculate it.
- Days Inventory Outstanding (DIO): How long you hold inventory before selling it.
- Days Sales Outstanding (DSO): How long it takes to collect payment after a sale.
- Days Payables Outstanding (DPO): How long you take to pay your suppliers.
The formula is DIO + DSO – DPO. The real question is how you can manipulate these numbers to your advantage. While you want to collect from customers quickly (low DSO), you might want to negotiate longer payment terms with suppliers (high DPO). However, be careful not to damage supplier relationships in the process. A negative C2C cycle is the dream scenario, as it means your customers are essentially financing your inventory.
According to ASCM (Association for Supply Chain Management), tracking this cycle helps organizations identify inefficiencies in their accounts receivable and procurement departments. If your C2C cycle is lengthening, it is a red flag that your supply chain is becoming sluggish. The practical takeaway is to review your credit terms and inventory levels simultaneously to tighten this loop.
Forecast Accuracy and the Fill Rate
Forecast accuracy is the detail that changes everything for your planning team. It measures the difference between what you predicted would sell and what actually sold. High accuracy prevents the two biggest headaches in logistics: stockouts and excess inventory. This is where it gets practical. If your forecast is consistently off by 20 percent, you are either losing sales or paying for warehouse space you do not need.
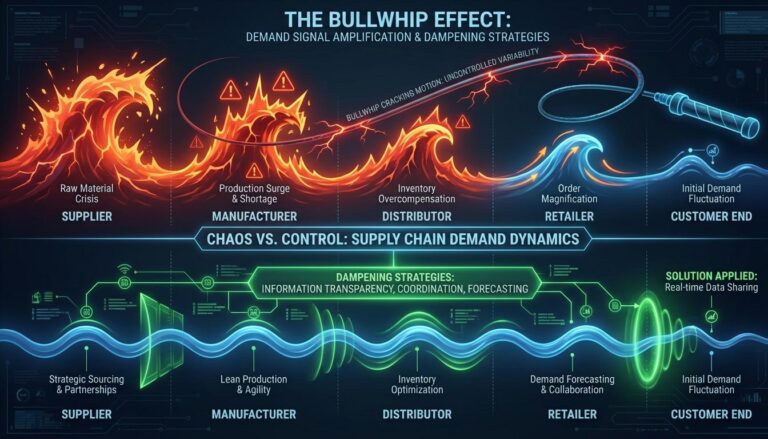
When accuracy is low, you often see the “bullwhip effect” take hold. This is where small fluctuations in demand cause massive ripples of inefficiency further up the chain. For a deeper look at preventing this, see our specialized post on the bullwhip effect supply chain. Improving your forecast by even 5 percent can lead to significant cost savings in storage and expedited shipping fees.
Related to this is the Fill Rate. This is the percentage of customer demand that is met through immediate stock availability. There are three ways to look at this:
- Order Fill: The percentage of entire orders sent on the first shipment.
- Line Fill: The percentage of individual order lines filled.
- Unit Fill: The percentage of total items delivered.
Your best move is to track all three. If your unit fill is high but your order fill is low, it means you are missing small, critical items that prevent a customer from using their purchase. This usually points to a breakdown in your tactical planning.
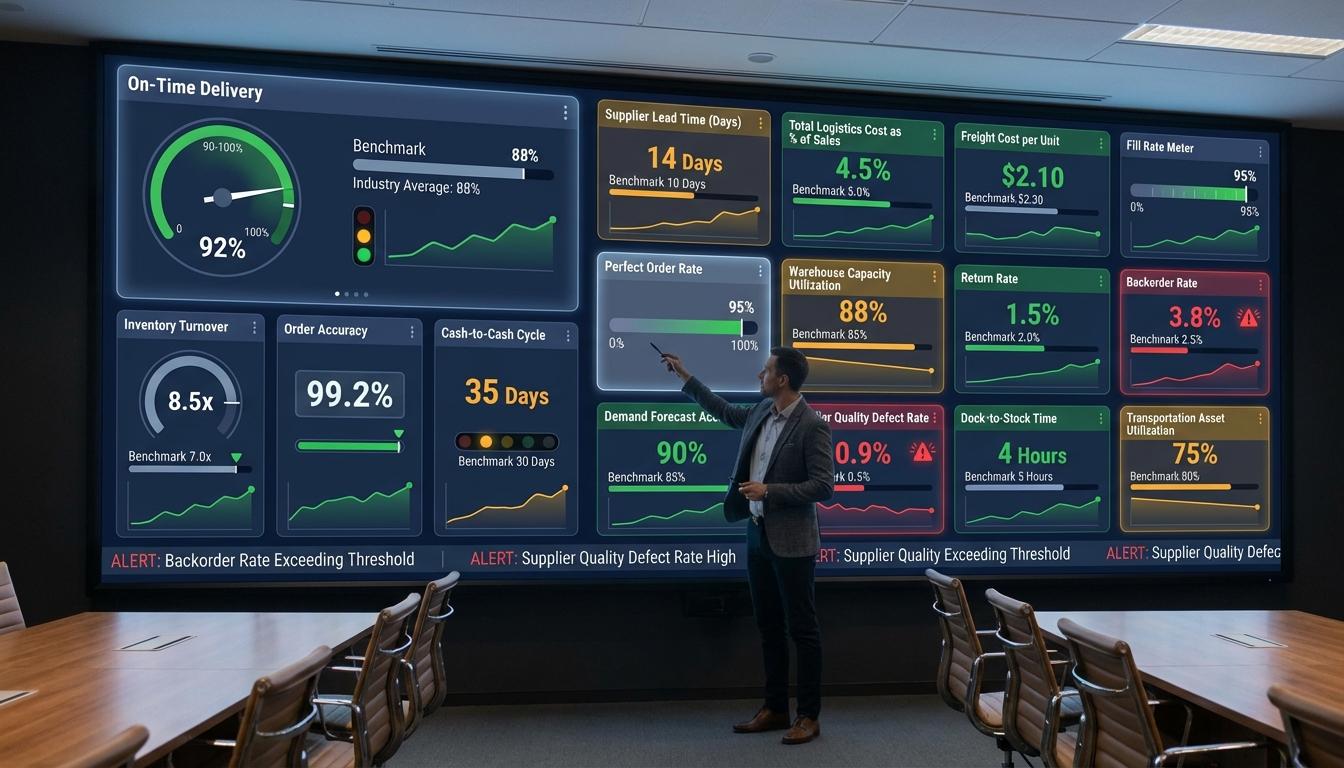
Quick Reference: Supply Chain KPIs at a Glance
- Perfect Order Rate: Aim for 95%+. Measures accuracy, timing, and condition.
- On-Time Delivery: Target 95%+. Crucial for customer retention.
- Inventory Turnover: Healthy range is 5-10. Measures capital efficiency.
- Cash-to-Cash Cycle: Lower is better. Measures liquidity and financial health.
- Fill Rate: Target 98% for unit fill. Measures immediate stock availability.
- Warehouse Utilization: Aim for 80-85%. Too high causes congestion; too low is wasted money.

Common Questions About Supply Chain KPIs
What is the most important supply chain KPI?
The direct answer is the Perfect Order Rate. It is the most comprehensive metric because it encompasses on-time delivery, order completeness, and product quality. If your POR is high, it is a strong indicator that your operational processes are aligned and efficient.
How often should we review our supply chain scorecards?
We recommend a tiered approach. Operational metrics like inventory accuracy should be reviewed daily. Tactical metrics like forecast accuracy should be reviewed monthly. Strategic metrics like the Cash-to-Cash cycle are best reviewed quarterly to align with financial reporting.
What is a good benchmark for inventory accuracy?
You should strive for 99 percent or higher. Anything lower than 95 percent suggests a major breakdown in your warehouse management system or cycle counting processes. Research from NetSuite shows that high inventory accuracy is the foundation for almost every other supply chain metric.
Why is my On-Time Delivery high but my customers are still unhappy?
The short version is that you might be measuring OTD based on when the package leaves your dock rather than when it arrives at the customer’s door. You might also be missing the “In-Full” part of the equation. A package delivered on time is useless if it only contains half of what was ordered.
Final Action Steps for Managers
Now you have the specific answer to which supply chain KPIs matter most. The key point is that you cannot manage what you do not measure. Start by establishing your baseline for the Perfect Order Rate and Inventory Turnover. These two metrics alone will tell you more about your business than a dozen surface-level reports. Once you have these basics down, you can begin to refine your strategy for long-term growth.
Your next step is to audit your current data collection methods. Are your metrics based on real-time data or manual spreadsheets that are outdated by the time you read them? Moving toward automated, real-time reporting is the only way to stay competitive.