Geographic Supply Chain Risk: Assessing Location Vulnerabilities
Are you relying too heavily on a single dot on the map? If the last few years have taught us anything, it is that geographic supply chain risk is often the invisible thread that, when pulled, unravels an entire operation. You might have the best suppliers in the world, but if they are all sitting in the same flood zone or under the same volatile political regime, your resilience is an illusion. We are not just talking about “country risk” in a broad sense anymore. We are talking about the specific, granular vulnerabilities that come with where your goods are made, where they sit, and how they move.
You probably already know that diversification is a good idea. Most managers do. But the real challenge is moving beyond the surface level to understand the actual mechanics of location based vulnerability. This is the detailed breakdown you have been searching for. We are going to explore how concentration creates single points of failure and, more importantly, exactly how you can measure and mitigate these risks before the next localized shock hits your bottom line. Let us get into the details.

The Core Mechanics of Geographic Supply Chain Risk
At its most basic level, geographic supply chain risk emerges when too much value, capacity, or specialized knowledge is concentrated in a limited number of places. It is the classic “all eggs in one basket” scenario, but with a global twist. When we look at this closely, we see that concentration happens in three distinct ways.
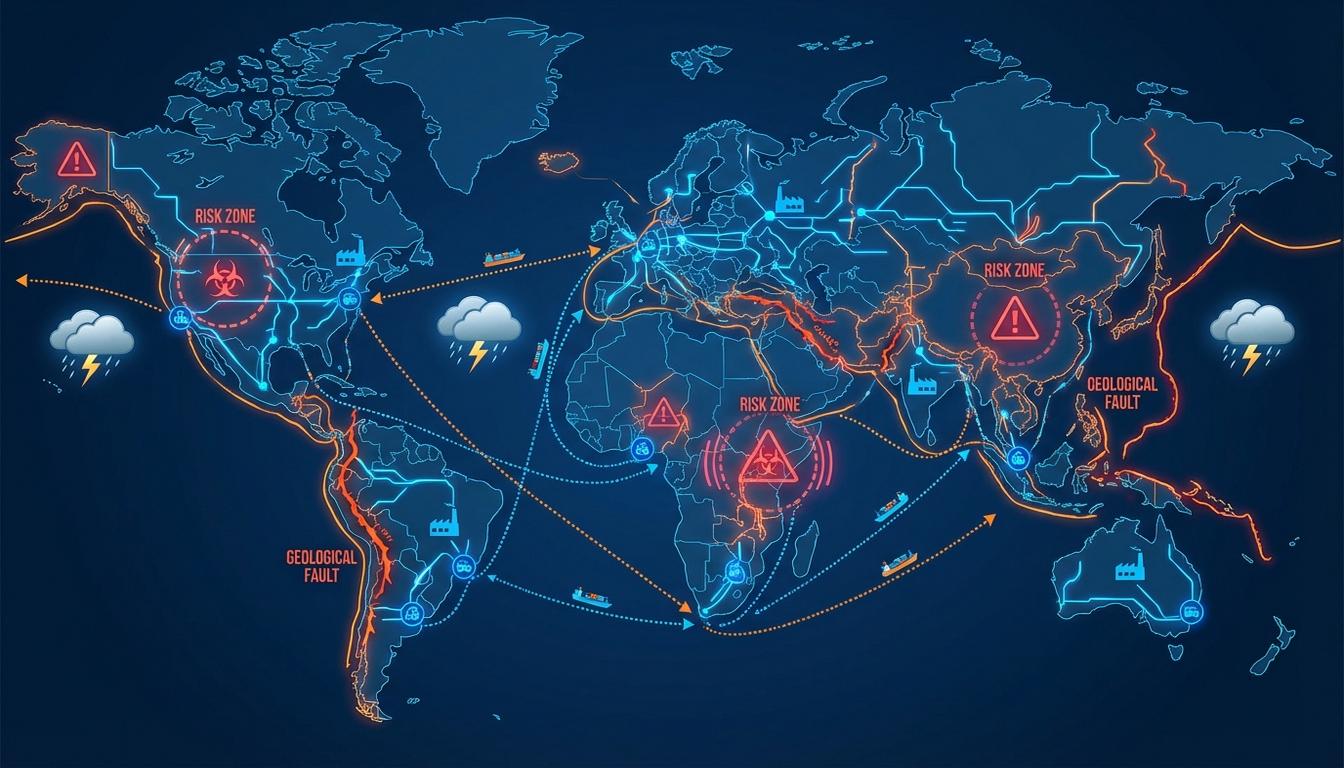
First, there is regional concentration. This is when your primary and secondary suppliers are located in the same country or neighboring regions. A single earthquake in Japan or a lockdown in a Chinese industrial hub can halt production globally because there is no geographic “circuit breaker.” The 2011 Great East Japan Earthquake remains the textbook example of this, where concentrated production of automotive parts and electronics became a global choke point overnight.
Second, we have transport corridor exposure. This is one of those areas where getting it right makes a real difference. You might have diversified suppliers, but if all their shipments pass through the same canal, port, or border crossing, you still have a geographic concentration risk. Think of it as a funnel. The source is wide, but the neck is narrow.
Finally, there is the clustering of critical items. This is the detail that changes everything. Certain components, like high end semiconductors or specific battery chemistries, are produced in very few locations worldwide. Even if your direct supplier is in a “safe” zone, their sub-suppliers might be clustered in a high risk area. The practical takeaway is that you cannot just look at your Tier 1 partners. You have to look at where the value is actually created.
Volume vs. Network Concentration: Why Frequency Matters
Modern risk management distinguishes between how much value comes from a place and how often your chain touches that place. This is a nuance most people miss. To truly assess your exposure, you need to look at two specific metrics: Volume Concentration and Pass-Through Frequency (PTF).
Volume concentration is straightforward. It measures how much of a product’s value added originates in a specific country. For example, if 80% of your component value comes from South Korea, you have a high volume concentration risk there. According to research from the Institute of Developing Economies (IDE-JETRO), this is how many EU firms discovered their extreme dependency on Russian energy only after the geopolitical situation shifted.
Pass-Through Frequency (PTF) is the newer, more sophisticated metric. It measures how often your production paths pass through a specific country, even if the value added at each step is small. Here is the thing most people miss: even if you source from five different countries, all five might rely on a single country for raw materials or intermediate processing. If your supply chain “passes through” a high risk geography multiple times, your nominal diversification is a myth. For your specific case, high PTF values indicate that your alternative routes are not actually alternative routes at all.
Your next step is to evaluate your critical components through both lenses. A country might be low in volume but high in frequency, making it a hidden “silent killer” for your continuity plans.

Conducting a Precise Regional Risk Assessment
When it comes to regional risk assessment, we have to look beyond just “is this country stable?” We need to evaluate the specific political, economic, and infrastructural conditions that affect supply reliability. This is where a country risk supply chain analysis becomes essential.
A structured assessment should focus on these four pillars:
- Geopolitical and Policy Risk: This includes trade wars, tariffs, and export controls. The US-China trade tensions are the prime example here, as they directly increased costs and forced a massive shift in electronics sourcing.
- Regulatory and Compliance Risk: Are you operating in a region with changing labor laws or environmental regulations? New supply chain due diligence laws mean that a regional labor issue can become a legal nightmare for you.
- Macroeconomic Stability: Currency instability and capital controls can make it impossible for your suppliers to buy raw materials, even if their factory is perfectly fine.
- Infrastructure Quality: This is about more than just roads. You need to assess power grid stability, digital infrastructure, and port capacity. A region prone to blackouts is a region prone to delays.
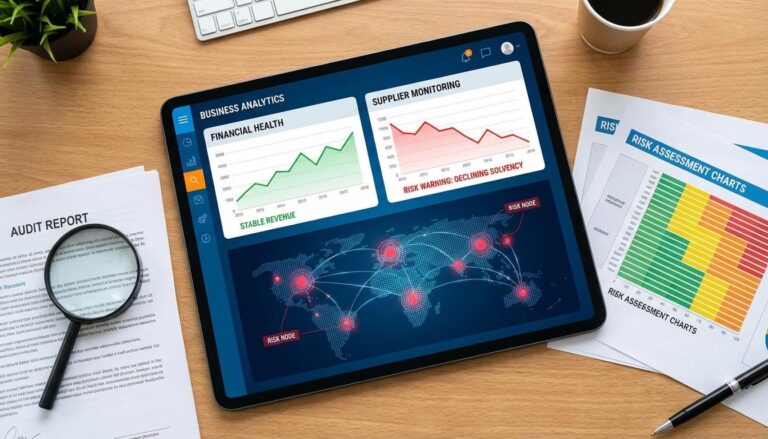
To do this effectively, we recommend starting with supply chain risk mapping to visualize exactly where these regional pressures intersect with your physical assets. By overlaying regional risk data onto your supplier map, you can identify clusters that are “in the red” across multiple categories.
The action item here is simple: assign a risk score to every sourcing region based on these pillars. If a region scores poorly on infrastructure and geopolitics, it should trigger a search for a secondary source in a different geographic quadrant.

Location Risk: Assessing Plants and Logistics Hubs
While regional risk is about the “neighborhood,” location risk is about the specific house. This is site-level analysis. You need to know the physical and operational risks associated with a specific supplier plant, warehouse, or port. This is where the details matter.
Natural hazards are the most obvious site risks. We recommend using hazard data from major reinsurers to rate each plant on its exposure to earthquakes, floods, hurricanes, and wildfires. But do not stop there. There are other location risks that are often ignored until they cause a problem.
Consider urban congestion. If a supplier is located in a hyper-congested metro area, their ability to meet just-in-time (JIT) delivery windows is constantly at risk. Traffic is a chronic disruption that erodes margin over time. Likewise, power reliability at the site level is critical. Does the plant have redundant power sources? If the local grid fails, does your production stop?
So what does this mean for you? It means you should be using digital geo-risk tools to visualize your critical plants on a map. When you can see that three of your “sole source” components are manufactured within 10 miles of each other in a flood-prone coastal zone, the risk becomes impossible to ignore. Your best move here is to link each plant location to the specific items they produce, allowing you to see exactly which products are at risk from a single localized event.
Geopolitical Supply Risk and the 2025 Outlook
Geopolitical supply risk has moved from a “rare event” to a “top-tier priority.” Industry analysts identify geopolitics as one of the most significant disruptors through 2025. This is the part you actually came here for because geopolitical shifts can happen much faster than natural disasters.
State-to-state conflicts, trade disputes, and sanctions are the primary drivers. When tensions rise, trade routes can be blocked overnight. But there is also a “soft” side to this risk. You must look at local population dynamics, including the frequency of strikes, protests, and general attitudes toward foreign firms. Public sentiment in a sourcing region can be just as disruptive as a formal tariff.
According to Xeneta, these risks are increasingly interacting with energy security and climate change. For example, a geopolitical conflict in a region that also serves as a major energy hub creates a double-whammy effect on your supply chain costs. Ready for the specifics? You should be monitoring “pass-through” countries that are currently in geopolitical “hot zones,” even if you do not source directly from them. If your shipments have to cross a contested border or transit through a high-risk sea lane, your geographic risk is elevated.
Quantifying Natural Disaster Risk Using VaR
How do you put a dollar value on the chance of a hurricane? This is where natural disaster risk assessment gets practical. The most effective way to measure this is through Value at Risk (VaR). This metric combines the probability of an event with the total value of the goods at stake.
Let us look at this closely with an example. Suppose you have a sole-source supplier in a region with a 10% annual probability of a major hurricane. If that supplier provides a critical component that contributes to $3 million in annual revenue, your VaR for that specific risk is $300,000 (0.10 x $3,000,000). When you calculate this across your entire supplier base, you can rank your risks by their financial weight rather than just a “feeling.”
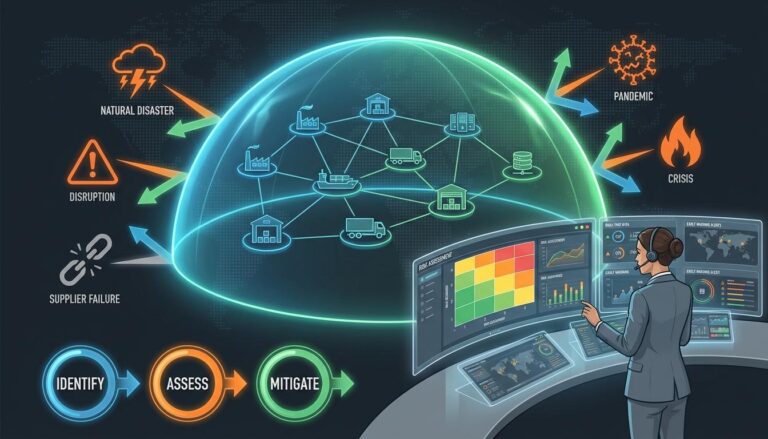
This quantitative approach is vital because it directly influences supplier financial risk monitoring. If a supplier’s location makes them high-risk, their financial stability is also at risk if they lack the insurance or capital to recover from a disaster. Here is the step-by-step breakdown for using VaR:
- Identify the annual probability of a major hazard (e.g., 5% for an earthquake).
- Calculate the total financial impact if that supplier goes offline for three months.
- Multiply the probability by the impact to get your VaR.
- Compare the VaR to the cost of qualifying a second source in a different geography.
If the cost of a second source is less than your VaR, the business case for diversification is already made.

Strategies for Mitigating Regional Concentration Risk
Now for the part where we turn knowledge into action. Reducing regional concentration risk requires a multi-layered approach. You cannot just move a factory overnight, but you can build a more resilient network over time. For a complete overview of the broader strategic context, check out our main guide on the supply chain risk management framework.
Here is what works and what does not when trying to de-risk your geography:
Geographic Diversification of Suppliers
The short version is: do not source critical inputs from a single country. But the detail is: ensure the secondary source is in a different tectonic and geopolitical zone. Sourcing from two different provinces in the same country is better than one, but it does not protect you from national-level shocks like tariffs or civil unrest.
Logistics Route Redundancy
Reduce your specific route concentration risk by qualifying alternate ports and carriers. If all your goods from Southeast Asia come through the Port of Long Beach, you are vulnerable to labor strikes or congestion there. Your best move is to have a “Plan B” route, such as an East Coast port or a different rail corridor, already vetted and ready to go.
Strategic Inventory Positioning
In regions where high risk is unavoidable, you must hold safety stock. But where you hold it matters. Pre-positioning inventory in a “safe” region—away from the sourcing hub—buys you the time needed to pivot if the primary hub fails. Think of this as your geographic buffer.
Real-Time Digital Monitoring
You need tools that flag emerging regional events in real time. Whether it is a localized lockdown, a sudden port strike, or an approaching storm, you need to know about it before your competitors do. The goal is to relate the event to your specific plants and materials immediately. If you have to spend three days figuring out which parts are affected, you have already lost the window to secure alternative capacity.

Quick Reference: Geographic Risk Assessment at a Glance
- Metric to Watch: Pass-Through Frequency (PTF) to find hidden dependencies.
- Key Tool: Digital geo-mapping with natural hazard overlays.
- Financial Metric: Value at Risk (VaR) for objective decision making.
- Red Flag: Over 50% of value added coming from a single country.
- Top 2025 Risk: Geopolitical tensions interacting with energy and climate.
- Immediate Action: Audit the physical plant locations of your top five critical suppliers.
Common Questions About Geographic Supply Chain Risk
What is the difference between country risk and geographic risk?
The answer is specificity. Country risk focuses on national-level factors like government stability and currency. Geographic risk includes those but adds site-specific physical hazards, transport route vulnerabilities, and the “pass-through” frequency of your entire network. It is a more granular, operational view.
Can we ever fully eliminate geographic concentration risk?
Not quite. Some materials or technologies are naturally clustered due to mineral deposits or specialized labor pools. The goal is not to eliminate it entirely, but to identify it, quantify the potential cost (VaR), and build enough “circuit breakers” (inventory or alternate routes) to survive a disruption.
How often should we update our geographic risk maps?
At a minimum, you should update them annually. However, for high-value components, you should have real-time digital monitoring that flags changes in regional risk levels—like a sudden increase in strikes or a change in tariff status—as they happen.
Is “China Plus One” an effective strategy for geographic risk?
Yes, and here is why: it creates a physical and political “circuit breaker.” By having a secondary source in a country like Vietnam, India, or Mexico, you mitigate the risk of a single-country policy change or regional disaster halting your entire production line. It is the most common way to reduce PTF and volume concentration simultaneously.
Putting it All Together
Managing geographic supply chain risk is no longer about checking a box once a year. It is about understanding the deep, often hidden connections between location and continuity. From calculating Value at Risk for natural disasters to auditing the pass-through frequency of your global network, the tools are now available to move beyond guesswork.
The practical takeaway is this: you cannot manage what you have not mapped. Start by identifying your most critical items and looking past the supplier’s corporate office to the actual factory floor. Your next step is to run a VaR analysis on your top three geographic clusters. Once you see the potential financial impact in black and white, the path toward a more resilient, geographically diverse supply chain becomes clear. Stay proactive, stay granular, and keep your map updated.